teubner_strey
Teubner-Strey model of microemulsions
Parameter |
Description |
Units |
Default value |
|---|---|---|---|
scale |
Scale factor or Volume fraction |
None |
1 |
background |
Source background |
cm-1 |
0.001 |
volfraction_a |
Volume fraction of phase a |
None |
0.5 |
sld_a |
SLD of phase a |
10-6Å-2 |
0.3 |
sld_b |
SLD of phase b |
10-6Å-2 |
6.3 |
d |
Domain size (periodicity) |
Å |
100 |
xi |
Correlation length |
Å |
30 |
The returned value is scaled to units of cm-1 sr-1, absolute scale.
Definition
This model calculates the scattered intensity of a two-component system using the Teubner-Strey model. Unlike dab this function generates a peak. A two-phase material can be characterised by two length scales - a correlation length and a domain size (periodicity).
The original paper by Teubner and Strey defined the function as:
where the parameters a2, c1 and c2 are defined in terms of the periodicity, d, and correlation length ξ as:
and thus, the periodicity, d is given by
and the correlation length, ξ, is given by
Here the model is parameterised in terms of d and ξ and with an explicit volume fraction for one phase, ϕa, and contrast, δρ2=(ρa−ρb)2 :
where 8πϕa(1−ϕa)(Δρ)2c2/ξ is the constant of proportionality from the first equation above.
In the case of a microemulsion, a2>0, c1<0, and c2>0.
For 2D data, scattering intensity is calculated in the same way as 1D, where the q vector is defined as

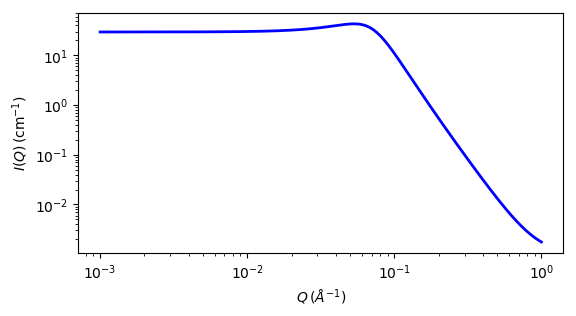
Fig. 123 1D plot corresponding to the default parameters of the model.
Source
References
M Teubner, R Strey, J. Chem. Phys., 87 (1987) 3195
K V Schubert, R Strey, S R Kline and E W Kaler, J. Chem. Phys., 101 (1994) 5343
H Endo, M Mihailescu, M. Monkenbusch, J Allgaier, G Gompper, D Richter, B Jakobs, T Sottmann, R Strey, and I Grillo, J. Chem. Phys., 115 (2001), 580
Authorship and Verification
Author:
Last Modified by:
Last Reviewed by: